Quick Summary:
High-traffic applications earn their name at the peak, when arrival rates jump many times above baseline within minutes. This guide defines the metrics that mark an application as high-traffic and walks through an eight-step performance testing strategy built around production workload data. It closes with the role AI now plays in modeling and analysis.
Table of Contents:
- Introduction
- What Makes an Application High-Traffic?
- A Step-by-Step Performance Testing Strategy for High-Traffic Applications
- Where AI Fits in Performance Testing
- Final Say
- FAQs
At one minute to nine on a Black Friday morning, somewhere between the marketing team’s countdown banner and the discount email arriving in a few million inboxes, an application meets the one exam its architects could only estimate in advance, the moment every customer shows up at once. Double the usual traffic? Planned for. Triple the checkout volume? Planned for. Then the affiliate links go live, and the traffic curve turns almost vertical.
The stakes keep rising with the sales. Adobe Analytics recorded $11.8 billion in U.S. online spending on Black Friday 2025, up 9.1% year over year, and Deloitte’s study with Google found that a 0.1-second mobile speed improvement lifted retail conversions by 8.4%. Performance testing is how teams rehearse that morning before it happens. This guide covers the metrics that define high traffic and an eight-step strategy for software performance testing at peak scale.
What Makes an Application High-Traffic?
High traffic is relative to design capacity. A platform sized for 500 requests per second handles 400 with room to spare, while a platform sized for 50 meets its limit at 300. Engineers therefore define high traffic through measurable rates and ratios, each one read against the application’s own baseline.
Metric |
What it measures |
Why it matters at peak |
| Peak concurrent users | Sessions active at the same moment | Sizes connection pools and session stores |
| Requests per second (RPS) | Server-side request rate across endpoints | Sets gateway limits and load generator capacity |
| Transactions per second (TPS) | Completed business actions, such as checkouts | Ties load to revenue-bearing flows |
| Peak-to-average ratio | Peak load divided by the daily average | Shows how much headroom autoscaling must create |
| Ramp rate | How fast traffic climbs to its peak | Exposes autoscaling lag and cold caches |
| p95 and p99 latency | Response time for the slowest 5% and 1% of requests | Reflects what the busiest customers experience |
| Error rate | Failed requests as a share of the total | Signals saturation as it begins |
The value of getting peak capacity right is measurable. Uptime Institute’s 2026 outage analysis found that 57% of survey respondents put the cost of their most recent major outage above $100,000. ImpactQA has also covered how load testing supports load management for high-traffic websites.
A Black Friday Sale, Seen From the Server Room
Consider a company that sells antivirus subscriptions. On an ordinary day, its store processes about 40 checkouts per minute. For Black Friday, it prices annual plans at a steep discount and schedules a launch email to four million existing users for 9:00 a.m. Affiliate partners post the deal at the same minute.
By 9:05, checkouts arrive at 1,600 per minute, a 40x jump. Each purchase calls a payment gateway and a license service that generates activation keys and writes entitlements to a database. Meanwhile, millions of installed antivirus clients keep checking for signature updates through the same API gateway, so sale traffic stacks on top of a heavy background load.
The first constraint surfaces in the license service. It holds a database connection for each key it generates, and its pool of 200 connections fills within minutes. New requests queue, p99 latency climbs past the payment gateway’s timeout, and customers facing a spinning button click again. Each retry adds load, and the retry wave roughly doubles the effective arrival rate. A strategy built around that one morning would have surfaced the pool limit weeks earlier, in a test environment.
A Step-by-Step Performance Testing Strategy for High-Traffic Applications
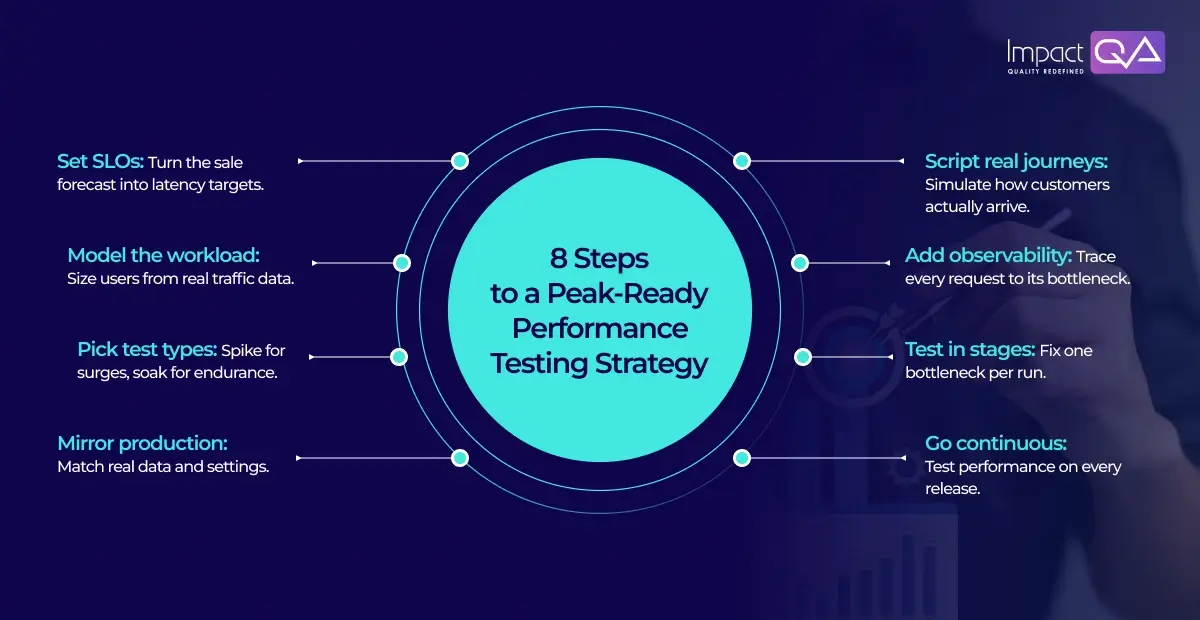
Each step below feeds the next, and the antivirus sale runs through them as a worked example.
Step 1: Translate Business Goals Into Measurable SLOs
Start with the business event and work backward. The antivirus team forecasts 1,600 checkouts per minute and wants pages to feel instant during the sale. That becomes a service level objective, such as p95 checkout API latency under 800 ms with an error rate below 0.5% at 2,000 checkouts per minute. The 25% margin above forecast covers marketing upside. Write SLOs per journey, since a product page and a payment call carry different tolerances, and agree on them with product owners before scripting begins.
Step 2: Build a Workload Model From Production Evidence
A workload model describes how fast users arrive and which actions they perform. Pull it from analytics and access logs of the previous peak event, then scale it by the marketing forecast. Little’s Law connects the numbers. Concurrent sessions equal the arrival rate multiplied by average session time, so 30 new sessions per second with a five-minute average session yields about 9,000 concurrent users. The transaction mix matters as much as volume.
In the antivirus case, roughly a quarter of sessions reach checkout while the rest browse and compare plans, and update checks from installed clients form a separate steady stream.
Step 3: Map Test Types to Specific Risks
Each test type answers one question about the peak. Load tests confirm the system meets its SLOs at forecast volume, and stress tests push beyond it to find where degradation begins. Spike tests replay the 9:00 a.m. jump within seconds, showing how quickly autoscaling adds capacity.
Soak tests hold steady load for eight to twelve hours, surfacing memory leaks and slow connection exhaustion that appear only over time. Breakpoint tests raise load in steps until the first SLO breach, giving capacity planners a hard number.
Step 4: Prepare a Production-Like Environment and Test Data
Results transfer to production in proportion to how closely the test environment matches it. Mirror instance types and autoscaling policies, and keep CDN and WAF rules identical so caching behaves the same way. Database volume matters as much as hardware, since a query plan that suits 10,000 rows can change at 50 million. Payment gateways typically restrict load against their live endpoints, so service virtualization stands in with recorded latency profiles. Seed enough unique accounts and payment tokens for caches to show realistic hit rates. For cloud-hosted stacks, ImpactQA covers environment techniques in cloud performance testing.
Step 5: Select Performance Testing Tools and Script Realistic Journeys
Performance testing tools fall into two families. Protocol-level tools such as JMeter and k6 generate HTTP traffic at scale with a low cost per virtual user, while browser-based tools measure front-end rendering for a smaller sample of sessions.
Enterprise suites such as LoadRunner and NeoLoad add both in one platform. For flash sales, choose an open workload model. Closed models hold a fixed pool of virtual users who wait for each response, so a slowing server receives fewer requests and the queue a real crowd would build stays hidden. Open models inject arrivals at a set rate, matching how customers actually show up.
Scripts also need correlation for dynamic values like session IDs and CSRF tokens, along with think times drawn from production data. ImpactQA’s guide to performance testing tools compares leading software performance testing tools in more depth.
Step 6: Instrument the Stack for Observability
Load generators report what customers see, and observability explains why. Before the first run, connect APM agents and distributed tracing across services, then track RED metrics for each endpoint and USE metrics for each resource. Watch the quieter saturation points as well, such as connection pools and garbage collection pauses. Record latency in high-resolution histograms, since averages flatten the p99 tail where the busiest customers sit.
Step 7: Execute in Stages and Analyze Bottlenecks
Run a baseline at normal load first, so every later result has a reference point. Then step up in planned increments, holding each level long enough for autoscaling and caches to settle. When an SLO breaks, trace the slowest requests to the first saturated resource and resolve one constraint at a time.
In the antivirus case, the license service pool comes first. Raising it shifts the bottleneck to the entitlement database’s write throughput, which the next run measures. Report results as SLO pass rates per journey, with p95 and p99 curves plotted against load.
Step 8: Make Performance Continuous in CI/CD
A single pre-sale test captures one build. Continuous performance testing runs a short, fixed load profile on every merge and compares p95 latency against the last approved build, flagging the change when regression exceeds a set budget such as 10%. Full peak rehearsals then run weekly or ahead of each major event. Pairing these gates with automation testing services keeps functional and performance checks in one pipeline, an approach ImpactQA details in how continuous performance testing prevents production failures.
Where AI Fits in Performance Testing
AI in performance testing concentrates on the two ends of the strategy, the modeling that comes before a run and the analysis that follows it. Gartner projects that about 70% of enterprises will use AI-augmented testing tools by 2028, up from roughly 20% in 2025.
On the modeling side, machine learning clusters production sessions into distinct user journeys and forecasts peak arrival rates from past events and campaign calendars. Generative AI in performance testing drafts load scripts from recorded browser sessions or API specifications and suggests correlation rules for dynamic values, which shortens the most manual part of Step 5.
On the analysis side, anomaly detection scans thousands of time-series metrics during a run and flags the first one to deviate from its baseline. That ordering matters, since the first saturated resource is usually the root cause and later spikes are symptoms. Language models then summarize the run into a readable report that links each SLO breach to its trace evidence. Engineers still approve every workload model and every fix, and AI shortens the distance between a test run and a decision.
Final Say
Peak traffic is ultimately a business event with a technical consequence. When demand rises sharply, every dependency in the transaction chain becomes part of the customer experience, from the API gateway and application tier to databases, queues, third-party services, and the infrastructure supporting them.
A well-planned performance strategy gives engineering and business teams a common basis for deciding how much demand the platform can absorb, where capacity needs to change, and which risks must be addressed before the next major release or revenue-critical event.
ImpactQA’s performance engineering services help enterprises turn those decisions into measurable testing programs, combining workload engineering, observability, automation, service virtualization, and root-cause analysis. The objective is straightforward: give teams evidence they can use to make confident capacity and release decisions before customers provide that evidence for them.
Frequently Asked Questions (FAQs)
Share this post


Related Posts
Our Case Studies