
Quick Summary:
This blog explains how blockchain performance testing turns network behavior into numbers an enterprise can plan around. It defines the core evaluation terms, shows how to calculate transaction throughput and finality-based latency, and breaks gas costs down to the level of a business workflow. A seven-step SOP and a short tool guide follow, along with how ImpactQA supports performance validation for permissioned and public ledgers.
Table of Contents:
- Introduction
- 4 Evaluation Terms That Anchor Every Test
- 3 Metrics at the Center of Blockchain Performance Testing
- A 7-Step SOP for Blockchain Performance Testing
- 5 Blockchain Testing Tools for Performance Work
- Final Say
- FAQs
Real money moves on blockchains now. Banks settle on them, supply chain groups track goods across them, and Gartner’s March 2026 research says stablecoins and tokenized real-world assets have reached scaled deployment. McKinsey’s 2024 estimate puts tokenized financial assets at roughly $2 trillion by 2030.
So the questions product teams ask get sharper. How many transactions will the network commit per second at peak? And how long before each one is final?
Blockchain performance testing is the branch of blockchain testing that puts numbers on both. You time each transaction through the network under that network’s own commit rules, and you watch what happens as volume climbs. Settlement windows that drift during a spike show up here. So does gas use that creeps upward after a protocol upgrade.
AI has started to help, too. Teams now use it to sketch workload models from production traces and to catch regressions between builds.
Work with ImpactQA to validate nodes, consensus behavior, and network configurations.
4 Evaluation Terms That Anchor Every Test
Pin these four definitions down first. Get them right, and your numbers will compare cleanly across platforms, and across your own releases too.
1. Test Harness
Think of the test harness as the rig: the hardware and software that push load into the network and write down what comes back. Load generators normally live outside the system under test, which keeps the readings close to what a real user would see. Monitoring agents are a different matter. They often sit right on the nodes, so their overhead goes in the report.
2. Load-Generating and Observing Clients
There are two kinds of client here. The load-generating client (usually a script) sends transactions in through a REST interface or an SDK. The observing client only listens. It picks up commit notifications or checks on transaction status, and leaves all the sending to the other client. Splitting the jobs this way keeps measurement overhead away from the path transactions travel.
3. System Under Test (SUT)
The system under test is whatever the ledger needs to run, node hardware and network setup included. Anything sitting outside that boundary, say an API gateway or a cache, gets its own line in the report. That way, if a read-acceleration layer is flattering your results, everyone can see it.
4. Network Size
Network size is the count of validating nodes that take part in consensus. Observer nodes sit outside that count.
Permissioned platforms make this more involved because transaction processing is split across different roles. Hyperledger Fabric, for example, uses endorsing peers and an ordering service. Report each group separately, along with its configuration and role in transaction processing. This gives readers a clearer picture of the network being tested. One ordering node plus twenty peers? List both groups, and give a resilience-based network size of one.
3 Metrics at the Center of Blockchain Performance Testing
Throughput is your capacity figure. Latency is the wait until a transaction reaches the commit or finality point you’ve agreed on, and on EVM-compatible chains, gas is what the execution costs.
#1 – Transaction Throughput
Transaction throughput is the rate at which valid transactions commit within a set window.
Throughput (TPS) = Valid transactions committed / Measurement window in sec.
Count each committed transaction once, by the network’s own commit rule, and drop the rejected ones. What you’re left with is goodput, the work the ledger actually got done. Then put the node count and roles right next to the number, because 2,000 TPS on four validators and 2,000 TPS on forty are very different stories.
Peak and sustained runs answer separate questions. A peak run tells you how the network handles a short burst. A sustained run tells you whether it can keep a target rate going for hours. You’ve hit your capacity target once the network holds that rate while latency and errors stay inside the limits you set.
On Ethereum Virtual Machine (EVM) networks, look at gas consumed per second as well. It accounts for how heavy each transaction is, and a token swap is a lot heavier than a plain ETH transfer.
#2 – Transaction Latency
Transaction latency is the gap between submitting a transaction and reaching whatever point your team has defined as commit or finality.
Latency = Commit or finality timestamp – Submission timestamp
Where that point sits depends on consensus. In Raft, a log entry commits once a majority of voting members holds a copy. PBFT-style protocols commit at a quorum of 2f+1 replicas, usually in a 3f+1 setup. Proof-of-work chains lean on confirmation depth, and Ethereum’s proof-of-stake adds protocol-level finality through checkpoint voting.
There’s a wrinkle, though. Consensus can commit a transaction before every node has applied it. So a network-wide latency figure also needs a propagation threshold, the share of observed nodes that must show the transaction before you stop the clock.
Say you have a private network with 20 observed nodes. Nineteen of them apply a transaction within 25 seconds, and one straggler takes 35. At a 95% threshold, latency is 25 seconds. At 100%, it’s 35. Both are valid readings; the report just has to say which one it used.
Report latency as a distribution (p50, p95 and p99) in place of a single average. On public chains, where the validator topology is usually hidden, keep inclusion time and confirmation depth apart. For instance, give the block depth needed for your chosen confidence level and, right beside it, how long it took to get there.
#3 – Gas Costs
Gas is the meter for computation on an EVM-compatible network. Your fee is the gas used multiplied by the effective gas price.
Transaction fee = Gas used * Effective gas price
Under EIP-1559, that effective price is the base fee plus a priority tip, capped at whatever maximum fee the sender set. A simple ETH transfer between two wallets costs 21,000 gas. Contract calls cost more, and how much more depends on storage access and state changes. On Ethereum mainnet the base fee can shift by up to 12.5% from one block to the next, while other EVM chains may follow their own rules. That’s why a gas test should run across several fee conditions and report cost per business workflow, like one settlement or one token mint.
Upgrades move the goalposts as well. Fusaka went live on Ethereum mainnet in December 2025, setting a 60 million default block gas limit and capping any single transaction at 16,777,216 gas. Glamsterdam comes next, aiming for a 200 million gas limit and repriced state-creation costs. It was due on the Hoodi testnet on October 26, 2026, until developers postponed it on October 22 to take a closer look at how the EIP-8037 repricing affects contracts already deployed. There’s still no mainnet date. So check the live network configuration before you lock in any gas benchmark, and rerun your gas regressions after every fork.
Permissioned ledgers like Hyperledger Fabric run without EVM gas. Cost shows up elsewhere: in endorsement latency, CPU time per transaction and validation conflicts. In Fabric, you’ll see an MVCC (multi-version concurrency control) read conflict whenever concurrent transactions try to update the same key.
A 7-Step SOP for Blockchain Performance Testing
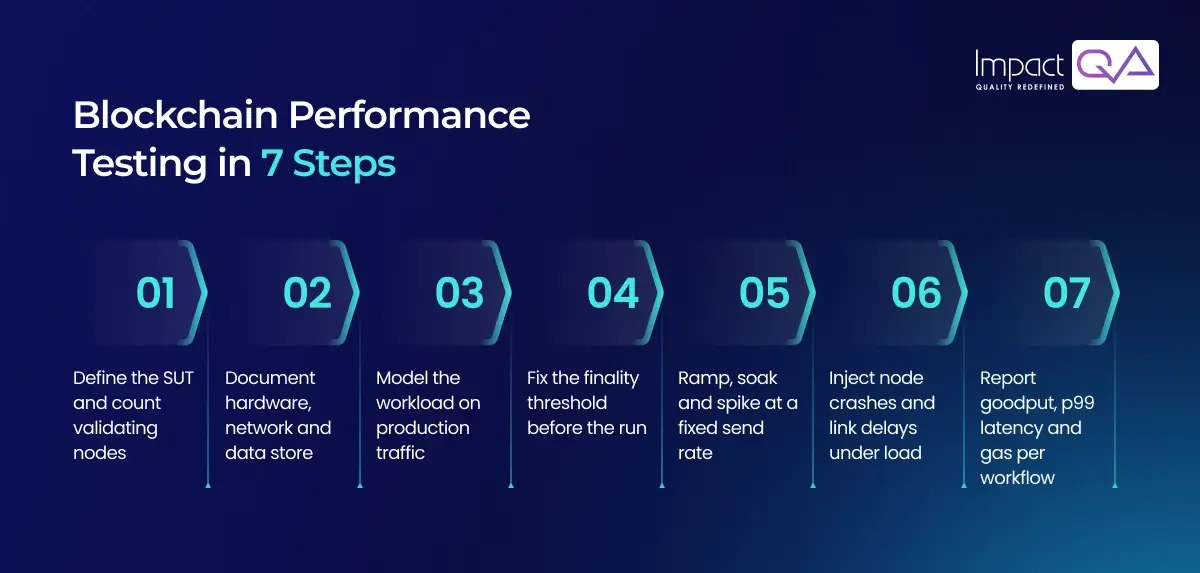
Here’s how to turn those metrics into a run you can repeat. It’s also where blockchain software testing plugs into day-to-day release work. Every step leaves something behind in the final report, so another team could rebuild your test and land on the same numbers.
Step #1: Define the SUT and Network Size
Write down every node, what it does and which consensus protocol it runs. Keep validators, peers and ordering nodes in their own groups. If an external database, gateway or cache is involved, name that too; you’ll want to measure its share of read performance separately.
Step #2: Document the Test Environment
Capture the node hardware first: CPU cores, memory, storage type. Then add where the nodes physically sit, the firewall rules between peers and the ledger data store (CouchDB or LevelDB, if you’re on Fabric). Pin every client, SDK and tool version. Aim for a record good enough that someone else could rebuild the whole setup from it alone.
Step #3: Model the Workload
Base the workload on what production really does. Replaying sanitized production traces works well, and adapting an existing benchmark to the chain is a fair fallback. Either way, match these traits to real usage:
- How compute-heavy each smart contract call is
- The mix of reads and writes
- Which transactions depend on others
- Payload size, since it drives propagation time
Then send traffic in through several clients and entry nodes at once. It’s the clearest way to see how the network copes when load arrives from many directions.
Step #4: Set Observation Points and the Finality Threshold
Set up observation points that capture submission, inclusion, commit and finality timestamps, wherever the platform exposes them. Decide your thresholds before the run starts. On permissioned networks, that means the protocol’s quorum rule plus an agreed propagation threshold. On public networks, it’s an agreed confirmation depth or finality policy.
Step #5: Execute Load Profiles
Begin with a low-load baseline. Next comes a stepped ramp, which helps you find the knee, the point where latency shoots up or throughput flattens out. Wrap up with a soak run lasting a few hours at the target rate, followed by a short spike above it.
Use an open-loop generator, one that keeps sending at a fixed rate regardless of how fast responses come back. Log the fee settings for every run as well, because inclusion priority moves with network demand. For EVM gas work, a local fork made with anvil –fork-url copies live contract state, so calls cost nothing. Keep in mind that a fork copies state only. Public mempool traffic and validator competition stay behind, so do your final latency checks on a testnet.
Step #6: Inject Faultloads
In production, crashed nodes, network partitions and slow links are just part of an ordinary week. A faultload brings them into the test while transactions keep flowing. You might stop a validator mid-run, add 200 ms of delay to a link, or force a leader change. Watch how throughput and latency move during the fault, then time how long the network takes to settle back to baseline.
Save replayed and badly signed transactions for a scenario of their own. They test validation logic as much as capacity.
Step #7: Calculate, Report and Gate
Work out goodput, latency at your declared threshold, gas per workflow and node resource use, mempool depth included where the network exposes it. Publish the full configuration alongside the results. Finally, hook the suite into CI/CD so automated testing for blockchain checks every build against the last accepted benchmark. In practice, this is what redefining quality benchmarks in digital transactions comes down to.
5 Blockchain Testing Tools for Performance Work
Most setups combine a few of these blockchain testing tools: something to generate load, something to profile gas and something to keep an eye on the nodes.
1 – Hyperledger Caliper
Caliper is an open-source benchmarking framework, and its current releases are built around Hyperledger Fabric 2.x. You define the transaction mix in JavaScript workload modules, and it reports success rate, throughput and latency. Check the release notes for supported platforms before you commit to it.
2 – Foundry and Hardhat Gas Reporting
Run forge test –gas-report in Foundry, or add the hardhat-gas-reporter plugin, and you get a gas figure for every contract function. Save those as baselines and CI can flag any jump after a code change.
3 – k6 and Apache JMeter
Both are general-purpose load generators that can hit JSON-RPC endpoints at a controlled rate. You’ll write short custom scripts for transaction signing, nonce management and receipt polling.
4 – Anvil Mainnet Forks
Anvil pulls live chain state onto a local node, so your contract calls run against real balances and storage at zero cost. It’s great for gas profiling. For network effects like mempool congestion, though, you’ll still want a public testnet.
5 – Prometheus and Grafana
Prometheus scrapes node metrics such as transaction pool size, peer count and block import time. Put them on a Grafana dashboard next to CPU and network activity, and it gets much easier to tell whether a bottleneck lives in execution or in peer networking.
For a wider view of the tooling landscape, see the 5 topmost tools for blockchain app testing.
Consult ImpactQA on building a fit-for-purpose testing stack.
Final Say
Enterprise ledgers already carry settlement workloads, and every protocol upgrade can nudge gas limits and execution costs. The Glamsterdam delay on Hoodi is a good reminder of how quickly roadmaps shift. Hence, performance baselines need fresh evidence after each major network change. And as tokenized assets grow, expect performance gates to sit in release pipelines right next to functional and security checks.
As a leading blockchain testing company, ImpactQA offers blockchain testing services across public, private and permissioned networks. Its 20+ certified consultants test smart contracts and peer and node behavior, along with the APIs that link a ledger to the rest of the business. On the performance side, that means workload modeling, load and endurance runs, and resilience checks under network stress, each measured against throughput and latency targets agreed up front. Results flow into continuous testing in CI/CD, so regressions show up well before release.
Download the full case study and see how it works in action.
Frequently Asked Questions (FAQs)
Share this post


Related Posts
Our Case Studies
