Quick Summary:
Generative AI can improve the ROI of performance testing because it cuts the hours spent on script creation, workload modeling, test data preparation and result analysis. Those savings let teams run performance checks more often and catch regressions earlier. This blog gives you an ROI formula a finance team can check, with a worked example, then walks through the five cost levers GenAI moves and how to measure each one. It also covers what to count on the cost side, including licensing and human review. We close with how ImpactQA’s AI-powered performance testing services apply these levers.
Table of Contents:
- Introduction
- The ROI Formula Behind Performance Testing Services
- 5 Cost Levers Generative AI Moves in Performance Testing
- How to Measure GenAI’s Share of the Return
- Final Say
- FAQs
Every digital business now runs on response times. A checkout that slows at peak load costs revenue by the minute. ITIC’s 2024 Hourly Cost of Downtime Survey found that a single hour of downtime costs more than $300,000 for over 90% of mid-size and large enterprises.
That number sits on the value side of performance testing services, where the return comes from avoided incidents and correctly sized infrastructure. The cost side has always been engineering labor, and scripting and result analysis take up most of it.
Here is the catch. When a test cycle takes weeks to prepare, teams test less often, and slowdowns reach production. Performance testing in software delivery pays off when it runs often enough to catch them.
Generative AI in performance testing works directly on that cost side. It drafts scripts from recorded traffic and helps build workload models from production telemetry, which can cut the effort behind each test cycle. Teams can then test more often.
ImpactQA wires AI-led performance regression into your pipeline.
The ROI Formula Behind Performance Testing Services
Performance testing ROI compares the value a test program protects with what the program costs to run. The example below calculates the ROI of the overall program; GenAI’s incremental return should be measured separately against the pre-AI baseline.
ROI (%) = [(Avoided Incident Cost + Labor Savings + Infrastructure Savings − Program Cost) / Program Cost] × 100
Avoided incident cost is the most significant factor and the most difficult to estimate; therefore, ensure that all inputs are done on an annual basis. Using your expected outage hours per year, multiply by the fraction the program is expected to avoid, then multiply by your hourly outage cost. The figures should be based on your incident history.
All other factors require the same consideration. Labor savings should consider the time required by engineers to evaluate and correct the AI results. Infrastructure savings should consider the cost of provisioning and running each test.
Here is how the sum could look for one year. The figures are illustrative and don’t reflect an ImpactQA customer result. The $300,000 hourly downtime cost is an example input; organizations should use their own downtime estimates.
S. No. |
Input |
Annual Figure |
| 1. | Expected outage hours without the program | 6 hours |
| 2. | Share of outage hours the program prevents | 50% |
| 3. | Hourly downtime cost | $300,000 |
| 4. | Avoided incident cost (3 hours × $300,000) | $900,000 |
| 5. | Labor saved, after review time | $120,000 |
| 6. | Infrastructure saved, after test run costs | $30,000 |
| 7. | Program cost, including AI licensing | $400,000 |
| 8. | ROI | 162.5% |
The program cost breaks into familiar parts. Engineers record and correlate scripts, model the load, prepare the test data, execute the test and analyze the results. Scripting and result analysis have traditionally taken the most of those hours, and this is where generative AI kicks in first.
5 Cost Levers Generative AI Moves in Performance Testing
1. Script Creation and Correlation
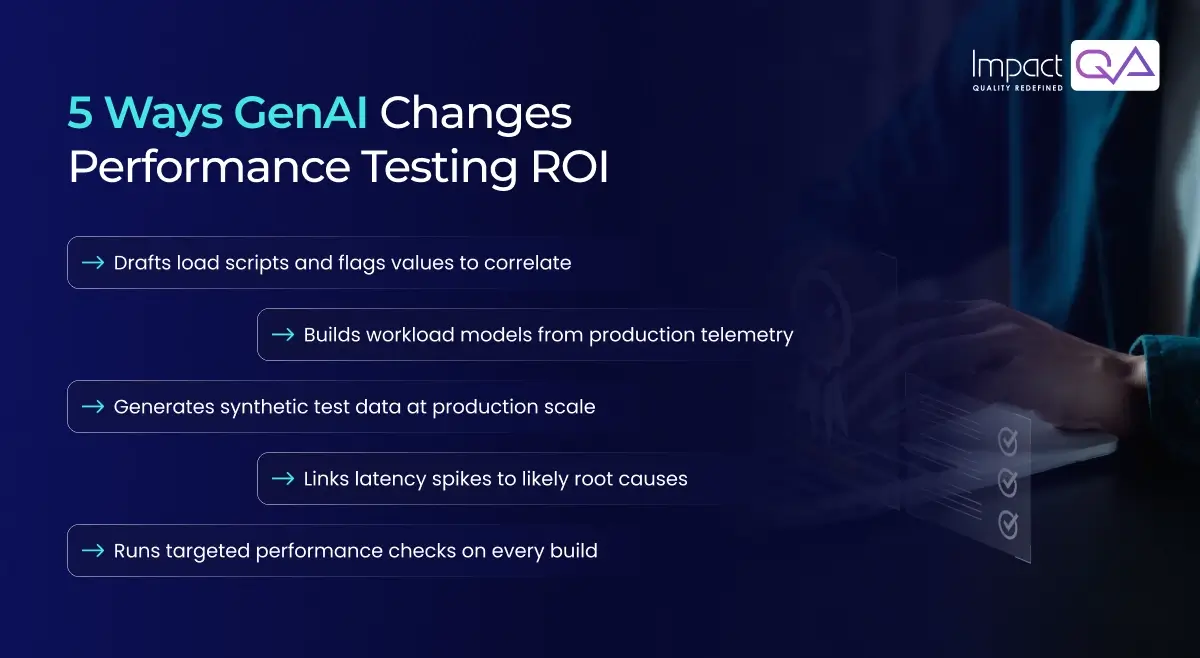
A load script simulates the traffic of the real users, and hence it should be able to deal with dynamic values like session tokens and CSRF tokens. This process of finding and parameterizing them is called correlation and is an intensive manual process. Now language models are capable of reading an HTTP Archive (HAR) file or OpenAPI definition, creating a script for JMeter or k6 and recommending what dynamic values should be correlated. An engineer still validates each extraction and parameter before the script runs.
Lever: scripting hours per scenario.
2. Workload Modeling from Production Telemetry
A test is only as accurate as its workload model. GenAI can read access logs and application performance monitoring (APM) traces to estimate the transaction mix and arrival rates for peak hours. Think time is harder, because server-side telemetry rarely shows it. That usually takes session-level data or client-side instrumentation.
Little’s Law then helps size the test. It estimates concurrent users from throughput and the time each user spends on a full transaction cycle. In a closed workload model, that cycle includes both application response time and user think time.
Concurrent Users = Transactions per Second (Throughput) × (Average Response Time + Average Think Time)
So at 50 transactions per second, with a 2-second response time and 8 seconds of think time, you would need about 500 virtual users. This estimate assumes one transaction per virtual-user cycle; journeys with multiple transactions need a workload model that accounts for the full user journey.
A realistic workload model reduces the risk of false passes, where a test looks healthy and still misses a production bottleneck. The method is covered in depth in planning a performance testing strategy for high-traffic applications.
Lever: model build time and production-match accuracy.
3. Synthetic Test Data at Volume
Realistic load tests require thousands of unique accounts, orders and sessions. Generative models can create realistic datasets similar to production data. Since the data is synthetic, there is less of a need to share sensitive production data in test environments. Each dataset should still be evaluated for privacy and compared to production to ensure the data is within the expected distributions.
Lever: data preparation time and compliance review effort
4. Result Analysis and Root-Cause Narratives
A single soak test can produce millions of data points. AI in performance testing can correlate latency percentiles with distributed traces, garbage-collection logs and database wait events, then draft a summary of the likely root cause. It might tie a p99 spike to connection-pool exhaustion in one service, for example. Engineers confirm the diagnosis and decide the fix.
Lever: analysis hours per test run.
5. Continuous Performance Regression in CI/CD
Together, the first four levers provide the ability to run more advanced performance tests at the build stage of the continuous integration, continuous delivery (CI/CD) pipeline. Short load tests compare each build against an accepted baseline, and AI can find statistically significant changes. The results of these tests can be noisy, so it’s essential to have stable test environments as well as repeat tests. Load generators can be provisioned only for a test run. In the CI/CD pipeline, performance regressions occur later, when they are generally cheaper to investigate and fix.
Lever: late-cycle defect cost and idle infrastructure spend.
How to Measure GenAI’s Share of the Return
Attribute savings to AI only when you can link them to its use. Record a baseline over several releases, then track the same metrics after roll-out. Prompt usage, licensing and human review time all belong in the program cost.
Lever |
Baseline Metric |
What to Track After Rollout |
| Scripting | Hours per scenario | Hours per scenario, including AI review and correction |
| Workload modeling | Days to build a model; gap between test and production transaction mix | Model preparation time and the gap between test and production transaction mix |
| Test data | Days to prepare a dataset; rejected datasets per cycle | Dataset preparation time and rejection rate per cycle |
| Analysis | Hours per run | Analysis hours per run and percentage of AI findings confirmed by engineers |
| CI/CD regression | Number and severity of performance defects found after release | Defects caught during build-stage testing and defects that still escape into production |
| AI operating cost | Existing testing tools and infrastructure costs | Total costs, including AI licensing, prompt usage, infrastructure and human review |
Human judgment stays central. Engineers set service level objectives (SLOs), approve capacity decisions and sign off on every AI-drafted finding. The wider shift is covered in how AI and generative AI define modern performance testing.
ImpactQA helps assess system capacity and identify performance bottlenecks before they affect users.
Final Say
The economics of software performance testing now favor a continuous signal over periodic projects. As generative AI lowers the effort behind each run, budgets can shift toward coverage and faster feedback. Performance testing companies and wider software testing companies that combine AI with site reliability engineering (SRE) practices can help enterprises improve release readiness and application reliability.
As a performance testing company that has delivered more than 350 projects, ImpactQA uses GenAI to streamline workload modeling and result analysis. Our engineers align load tests with business-focused SLIs and SLOs using OpenTelemetry-based observability. We also conduct chaos and resilience testing under peak-load conditions to assess system stability. Applying FinOps principles, we analyze cost per transaction to optimize auto-scaling and resource utilization. These capabilities complement our automation testing services, enabling teams to run performance and functional testing through the same CI/CD pipelines.
Frequently Asked Questions (FAQs)
Share this post


Related Posts
Our Case Studies